


 68 / 89

МОНГОЛЫН ХҮН АМЫН СЭТГҮҮЛ Дугаар (367) 20, 2011
67
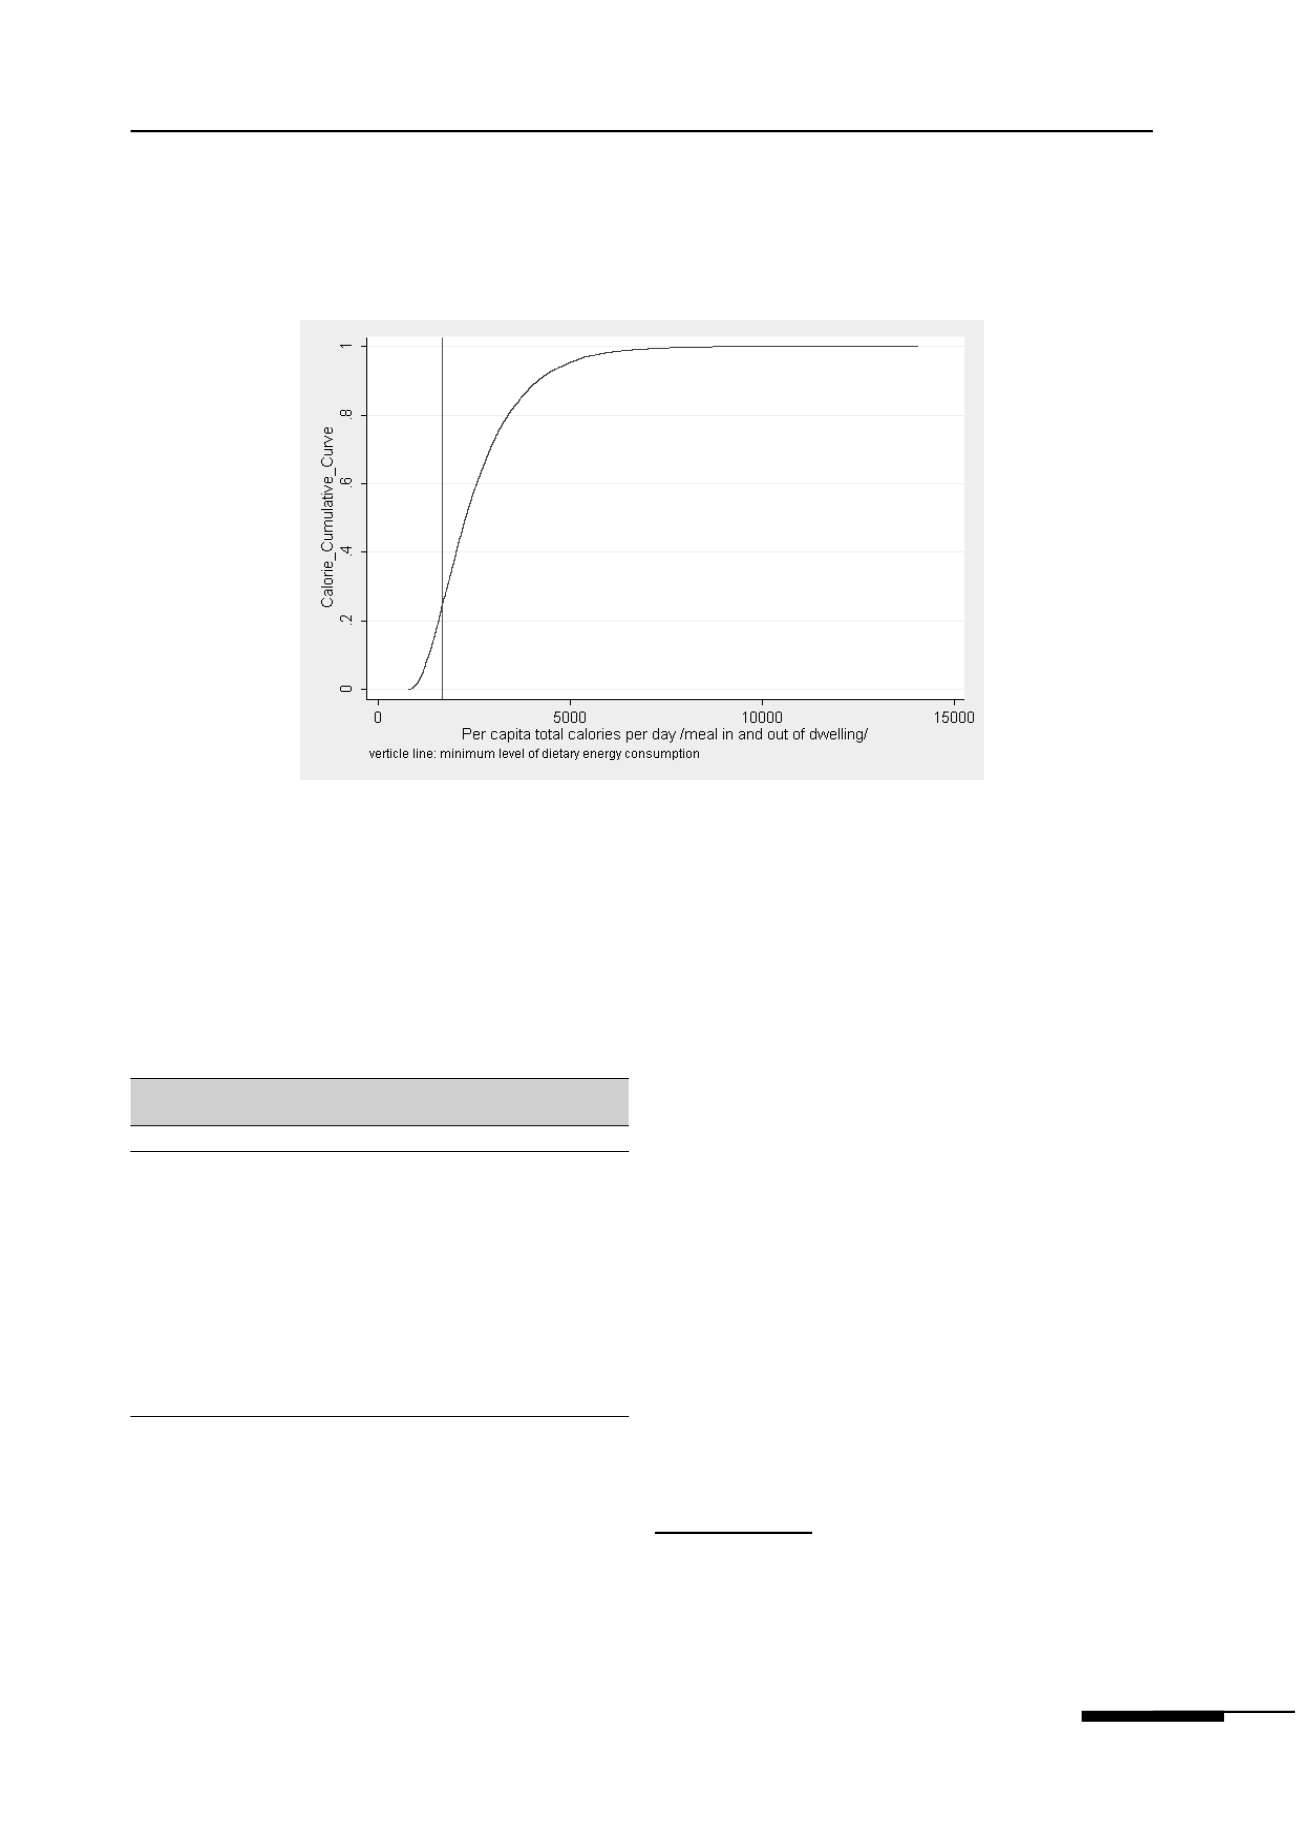
a given calorie consumption level on the
horizontal axis, the curve indicates on the
vertical axis the percentage of the population
with an equal or lesser level of calorie
consumption (Figure 1). If one thinks of the
chosen consumption level as the threshold, the
curve will show the associated calorie intake
headcount.
Figure 1:
Cumulative distribution of per capita calorie
Hence, at a minimum level of calorie 1680
per person per day, around 25 per cent of the
population is undernourished. Nonetheless,
given that the slope of the distribution is
relatively steep around that level, it is likely
that small changes in the minimum level
threshold will have large impacts on the
proportion of undernourished people.
Table 3:
Proportion of population below minimum level of
dietary energy consumption
Population group
Proportion of population
National
25.01
Poverty status Non poor
12.77
Poor
47.37
Urban/rural
Rural
28.65
Urban
22.31
Region
West
35.47
Highlands
28.54
Central
22.46
East
28.54
Capital
18.08
Table 3 presents the indicator which is
proportion of population below minimum level
of dietary energy consumption by national
and disaggregated level. The proportion of
population below minimum level of dietary
energy consumption in Mongolia is 25.1 per
cent, which means that around 660.0 thousand
individuals are considered undernourished.
29
From Table 3, we can see how does the
proportion vary across poverty status and
the country? The capital is the region with
less undernourished and the Central region
ranks second, three out of ten inhabitants are
undernourished in the East and Highlands.
Interestingly, this result is very consistent with
the incidence of poverty in Mongolia.
30
What is the sensitivity of these findings to
season
31
? A relevant feature of poverty and
consumption in Mongolia is its seasonality.
Livestock and agricultural activities may
determine
substantial
fluctuations
in
consumption along the year. The composition
of food consumption may change drastically,
with more intake of dairy products in the
summer, more vegetables in the autumn, more
meat products in the winter and somehow a
lean period during the spring. The autumn
is considered a season of relative abundance
because it benefits from the remaining higher
dairy production from the summer and the
29
The estimated population at the end of 2007, the mid-point of the
period covered by the household survey, was 2,635,169 according to
administrative data.
30
See, Poverty profile. NSO of Mongolia (2009)
31
Summer could be assumed to last from June to August; autumn,
September to November; winter, December to February; and spring,
March to May.