


 69 / 89

МОНГОЛЫН ХҮН АМЫН СЭТГҮҮЛ Дугаар (367) 20, 2011
68
early availability of meat for the winter. I try to
reveal that pattern using stochastic dominance
analysis. It relies on graphical tools and
focuses on the entire distribution of calorie
consumption.
32
From Figure 2, we can see
that spring and winter display the lowest levels
of calorie consumption in the year.
32
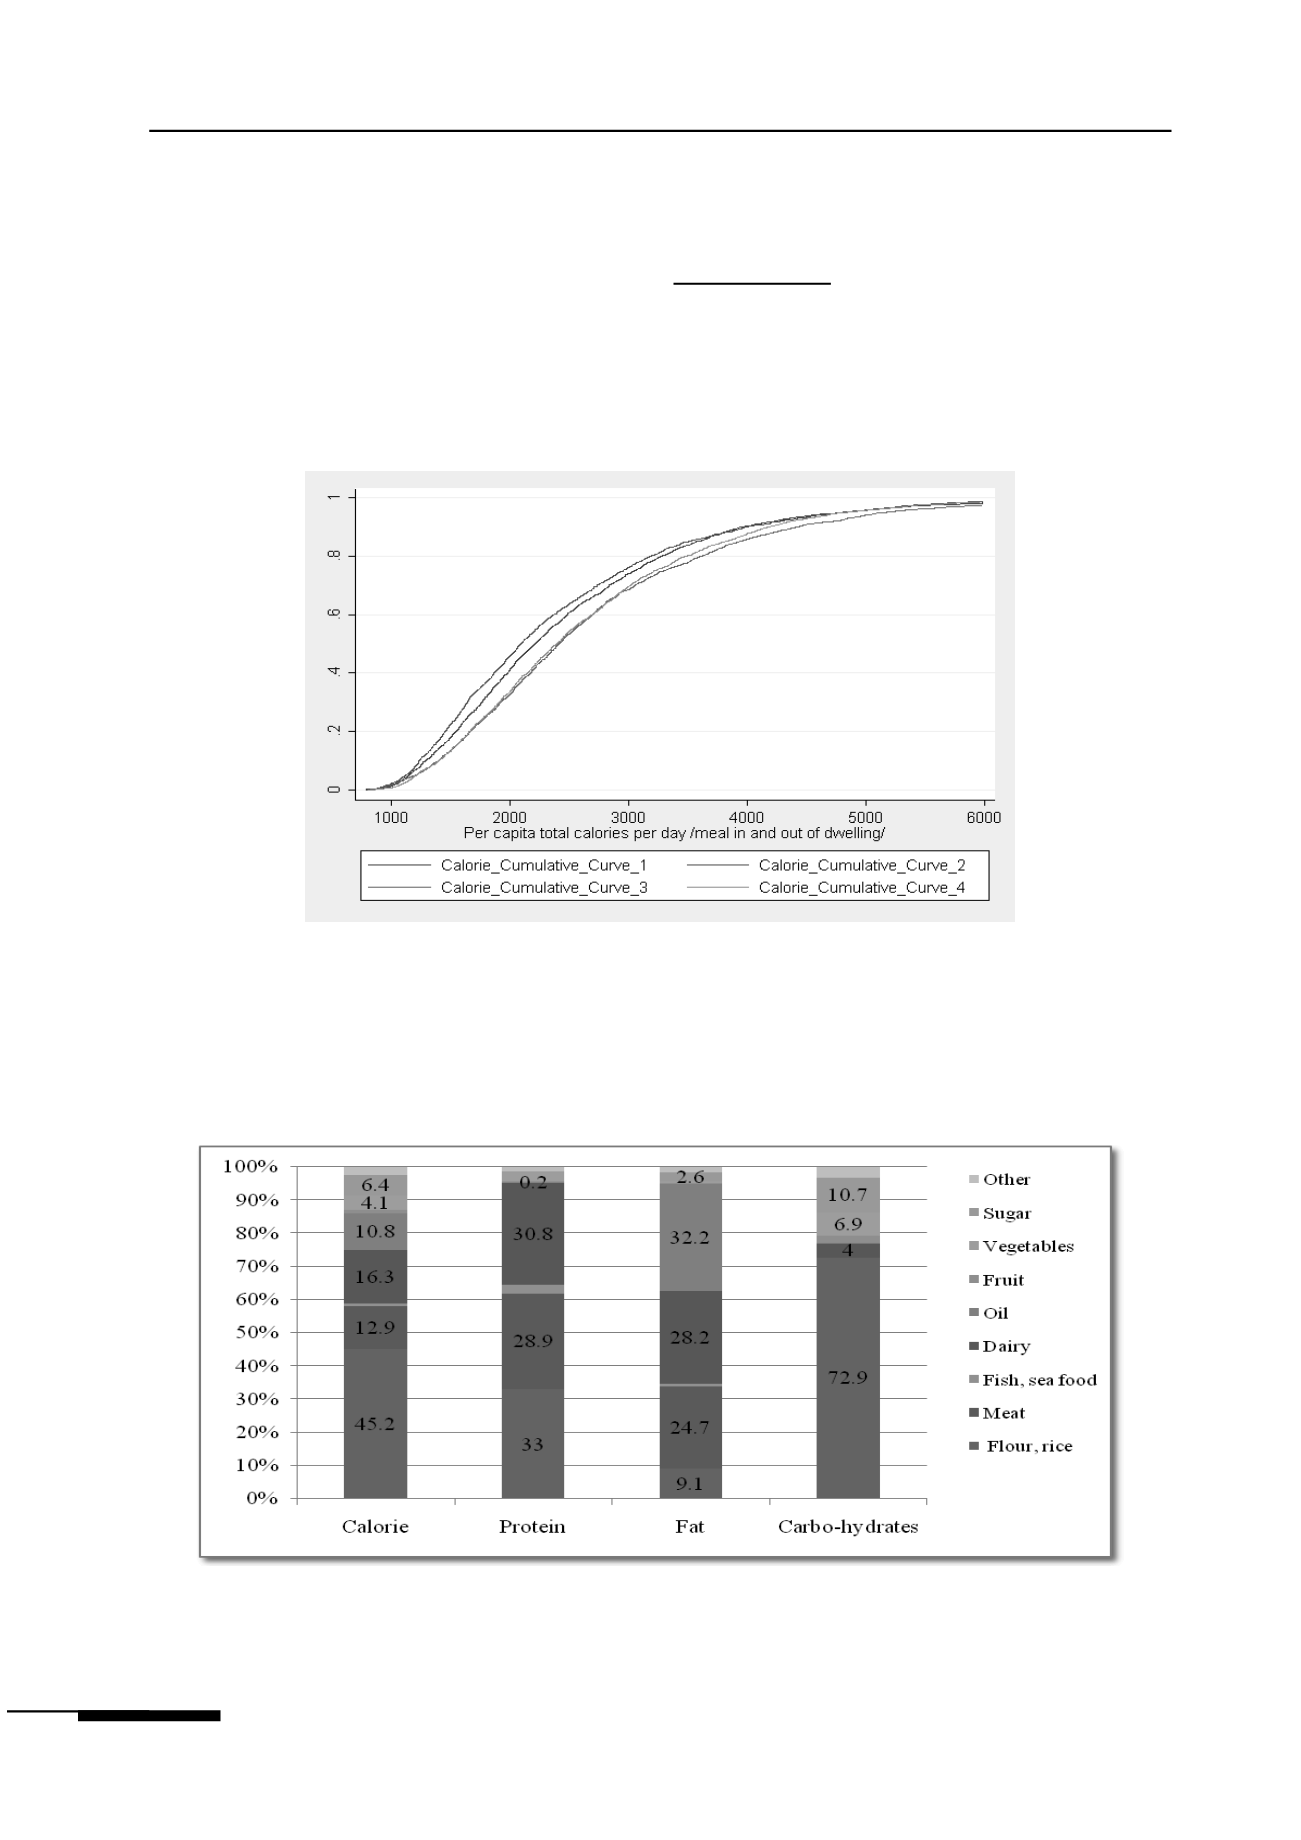
By plotting two or more cumulative density functions of per capita
calorie consumption in the same graph, it is possible to infer first-
order stochastic dominance. Distribution A first-order stochastically
dominates distribution B if for any given level of per capita calorie
consumption, the share of the population with a lesser or equal level of
consumption will always be lower in distribution B.
Figure 2:
Cumulative distribution of per capita calorie, by season
I then study group of foods households use
to get their calorie and macro nutrients from.
Figure 3 represents the percentage of nutrients
from different groups at national level. Flour,
rice are main source for calorie, protein and
carbohydrates and oil, dairy products are
seemed be main source for fat. The proportion
of nutrients from food groups by poverty is
displayed in the Table A.5 in the Appendix.
Figure 3:
Proportion of nutrients from food groups at national level