


 82 / 84

The Economist
September 22nd 2018
Economic and financial indicators
81
Other markets
% change on
Dec 29th 2017
Index
one
in local in $
Sep 19th
week
currency terms
United States (S&P 500)
2,908.0 +0.7 +8.8 +8.8
United States (NAScomp)
7,950.0 -0.1 +15.2 +15.2
China (Shenzhen Comp)
1,423.2 +1.4 -25.1 -28.8
Japan (Topix)
1,785.7 +5.6 -1.8 -1.5
Europe (FTSEurofirst 300)
1,486.0 +0.9 -2.8 -5.6
World, dev'd (MSCI)
2,172.3 +0.9 +3.3 +3.3
Emerging markets (MSCI)
1,019.7 +1.5 -12.0 -12.0
World, all (MSCI)
520.2 +1.0 +1.4 +1.4
World bonds (Citigroup)
932.2 -0.1 -1.9 -1.9
EMBI+ (JPMorgan)
782.3 +0.8 -6.4 -6.4
Hedge funds (HFRX)
1,259.6
§
+0.1 -1.3 -1.3
Volatility, US (VIX)
12.0 +13.1 +11.0 (levels)
CDSs, Eur (iTRAXX)
†
59.6 -3.2 +32.0 +28.3
CDSs, N Am (CDX)
†
56.1 -2.2 +14.3 +14.3
Carbon trading (EU ETS) €
21.5 -6.5 +164.1 +156.6
Sources: IHS Markit; Thomson Reuters. *Total return index.
†
Credit-default-swap spreads, basis points.
§
Sep 17th.
The Economist
commodity-price index
2005=100
% change on
one
one
Sep 11th Sep 18th*
month year
Dollar Index
All Items
137.5
135.9
-3.2 -7.1
Food
141.0
139.4
-3.2 -7.5
Industrials
All
133.8
132.2
-3.3 -6.8
Nfa
†
134.0
128.8
-5.1 -2.4
Metals
133.7
133.6
-2.5 -8.5
Sterling Index
All items
192.3
187.9
-5.3 -4.5
Euro Index
All items
147.5
144.4
-4.7 -4.9
Gold
$ per oz
1,190.7 1,199.3
+1.0 -8.4
West Texas Intermediate
$ per barrel
69.3
69.9
+6.1 +41.2
Sources: Bloomberg; CME Group; Cotlook; Darmenn & Curl; FT; ICCO;
ICO; ISO; Live Rice Index; LME; NZ Wool Services; Thompson Lloyd &
Ewart; Thomson Reuters; Urner Barry; WSJ. *Provisional
†
Non-food agriculturals.
Markets
% change on
Dec 29th 2017
Index
one
in local in $
Sep 19th
week
currency terms
United States (DJIA)
26,405.8
+1.6
+6.8
+6.8
China (Shanghai Comp)
2,730.9
+2.8
-17.4
-21.5
Japan (Nikkei 225)
23,672.5
+4.7
+4.0
+4.3
Britain (FTSE 100)
7,331.1
+0.2
-4.6
-7.3
Canada (S&P TSX)
16,149.9
+0.6
-0.4
-3.7
Euro area (FTSE Euro 100)
1,177.6
+1.3
-2.7
-5.4
Euro area (EURO STOXX 50)
3,368.6
+1.3
-3.9
-6.6
Austria (ATX)
3,375.2
+2.1
-1.3
-4.1
Belgium (Bel 20)
3,732.1
+1.1
-6.2
-8.8
France (CAC 40)
5,393.7
+1.2
+1.5
-1.3
Germany (DAX)*
12,219.0
+1.6
-5.4
-8.1
Greece (Athex Comp)
689.6
-0.1
-14.1
-16.5
Italy (FTSE/MIB)
21,280.8
+1.5
-2.6
-5.4
Netherlands (AEX)
543.1
+0.5
-0.3
-3.1
Spain (IBEX 35)
9,486.3
+1.9
-5.6
-8.2
Czech Republic (PX)
1,098.4
+0.8
+1.9
-0.8
Denmark (OMXCB)
897.5
-2.1
-3.2
-6.1
Hungary (BUX)
36,386.4
+0.8
-7.6
-13.8
Norway (OSEAX)
1,034.2
+0.5
+14.0 +14.3
Poland (WIG)
58,118.0
+2.2
-8.8
-13.8
Russia (RTS, $ terms)
1,134.1
+5.9
-1.8
-1.8
Sweden (OMXS30)
1,630.5 +0.7 +3.4 -4.7
Switzerland (SMI)
8,939.9 -0.2 -4.7 -4.0
Turkey (BIST)
96,603.8
+4.7
-16.2
-49.2
Australia (All Ord.)
6,297.0
+0.2
+2.1
-5.5
Hong Kong (Hang Seng)
27,407.4
+4.0
-8.4
-8.7
India (BSE)
37,121.2
-1.6
+9.0
-4.1
Indonesia (IDX)
5,873.6
+1.3
-7.6
-15.7
Malaysia (KLSE)
1,800.7
+0.9
+0.2
-2.1
Pakistan (KSE)
41,320.1
+2.0
+2.1
-9.3
Singapore (STI)
3,176.6 +1.7 -6.7 -8.9
South Korea (KOSPI)
2,308.5 +1.1 -6.4 -10.7
Taiwan (TWI)
10,857.3 +1.3 +2.0 -1.4
Thailand (SET)
1,749.8
+4.2
-0.2
+0.2
Argentina (MERV)
33,164.0 +11.5
+10.3
-47.3
Brazil (BVSP)
78,168.7
+4.1
+2.3
-17.9
Chile (IGPA)
27,104.7
+1.7
-3.1
-12.7
Colombia (IGBC)
12,329.0
nil
+7.4
+6.1
Mexico (IPC)
49,590.8
+0.7
+0.5
+4.8
Peru (S&P/BVL)*
19,175.8
+0.8
-4.0
-5.8
Egypt (EGX 30)
14,098.6
-9.0
-6.1
-7.0
Israel (TA-125)
1,493.9
+1.7
+9.5
+6.1
Saudi Arabia (Tadawul)
7,729.7
+1.2
+7.0
+7.0
South Africa (JSE AS)
56,445.6
+0.9
-5.1
-19.9
Indicators
for more countries and additional
series, go to:
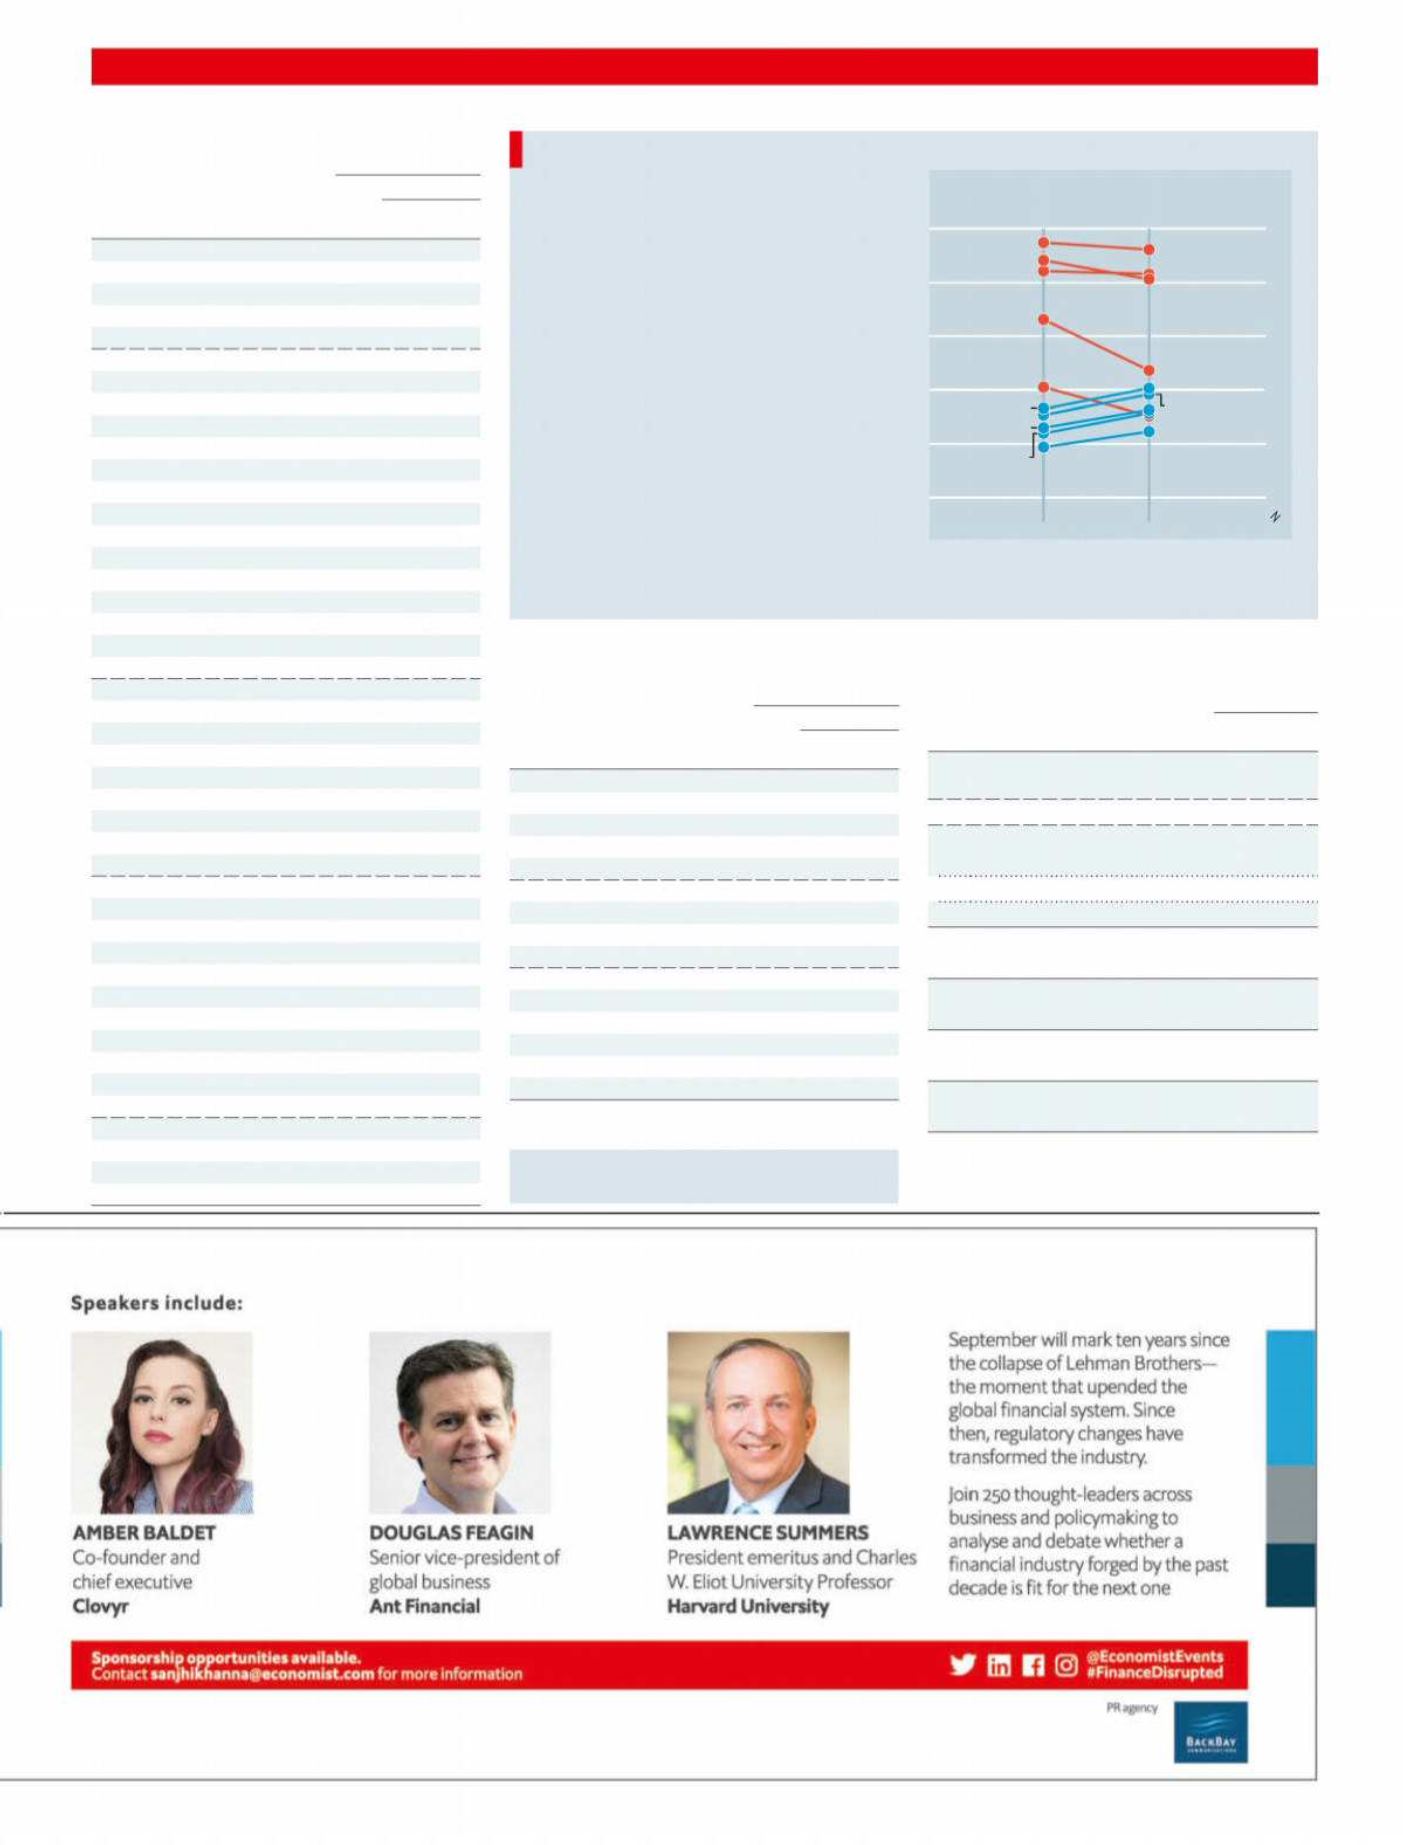
Economist.com/indicatorsHuman Development Index*
Source: UN Human
Development Report
*An index of life expectancy, education and income per person
†
% change in score, based on
data available for 188 countries
Best
and
worst
performers
†
1=maximum score
(Rank out of 189, 2017)
0.4
0.6
0.8
0.3
0.5
0.7
2012
2017
Congo
(176)
Ivory Coast
(170)
Togo
(165)
Ethiopia
(173)
Burkina Faso
(183)
Dominica
(103)
Venezuela
(78)
Libya
(108)
Yemen
(178)
Syria
(155)
Between 2012 and 2017 Congo made the
greatest strides in human development,
according to the
UN
’s Human Devel-
opment Index. In 2017 people in the
central African country lived for over two
years longer, and could expect to spend
almost one year more in school, than they
did five years before. Average income per
person was also 20% higher than in 2012.
The three countries that performed worst
over that period are war-torn. In Syria
incomes have fallen by almost half since
the war began in 2012. The
UN
also calcu-
lates an adjusted index that takes in-
equality into account. On average, this
reduces countries’ scores by 20%; Con-
go’s falls by over 30%.