


 83 / 89

МОНГОЛЫН ХҮН АМЫН СЭТГҮҮЛ Дугаар (367) 20, 2011
82
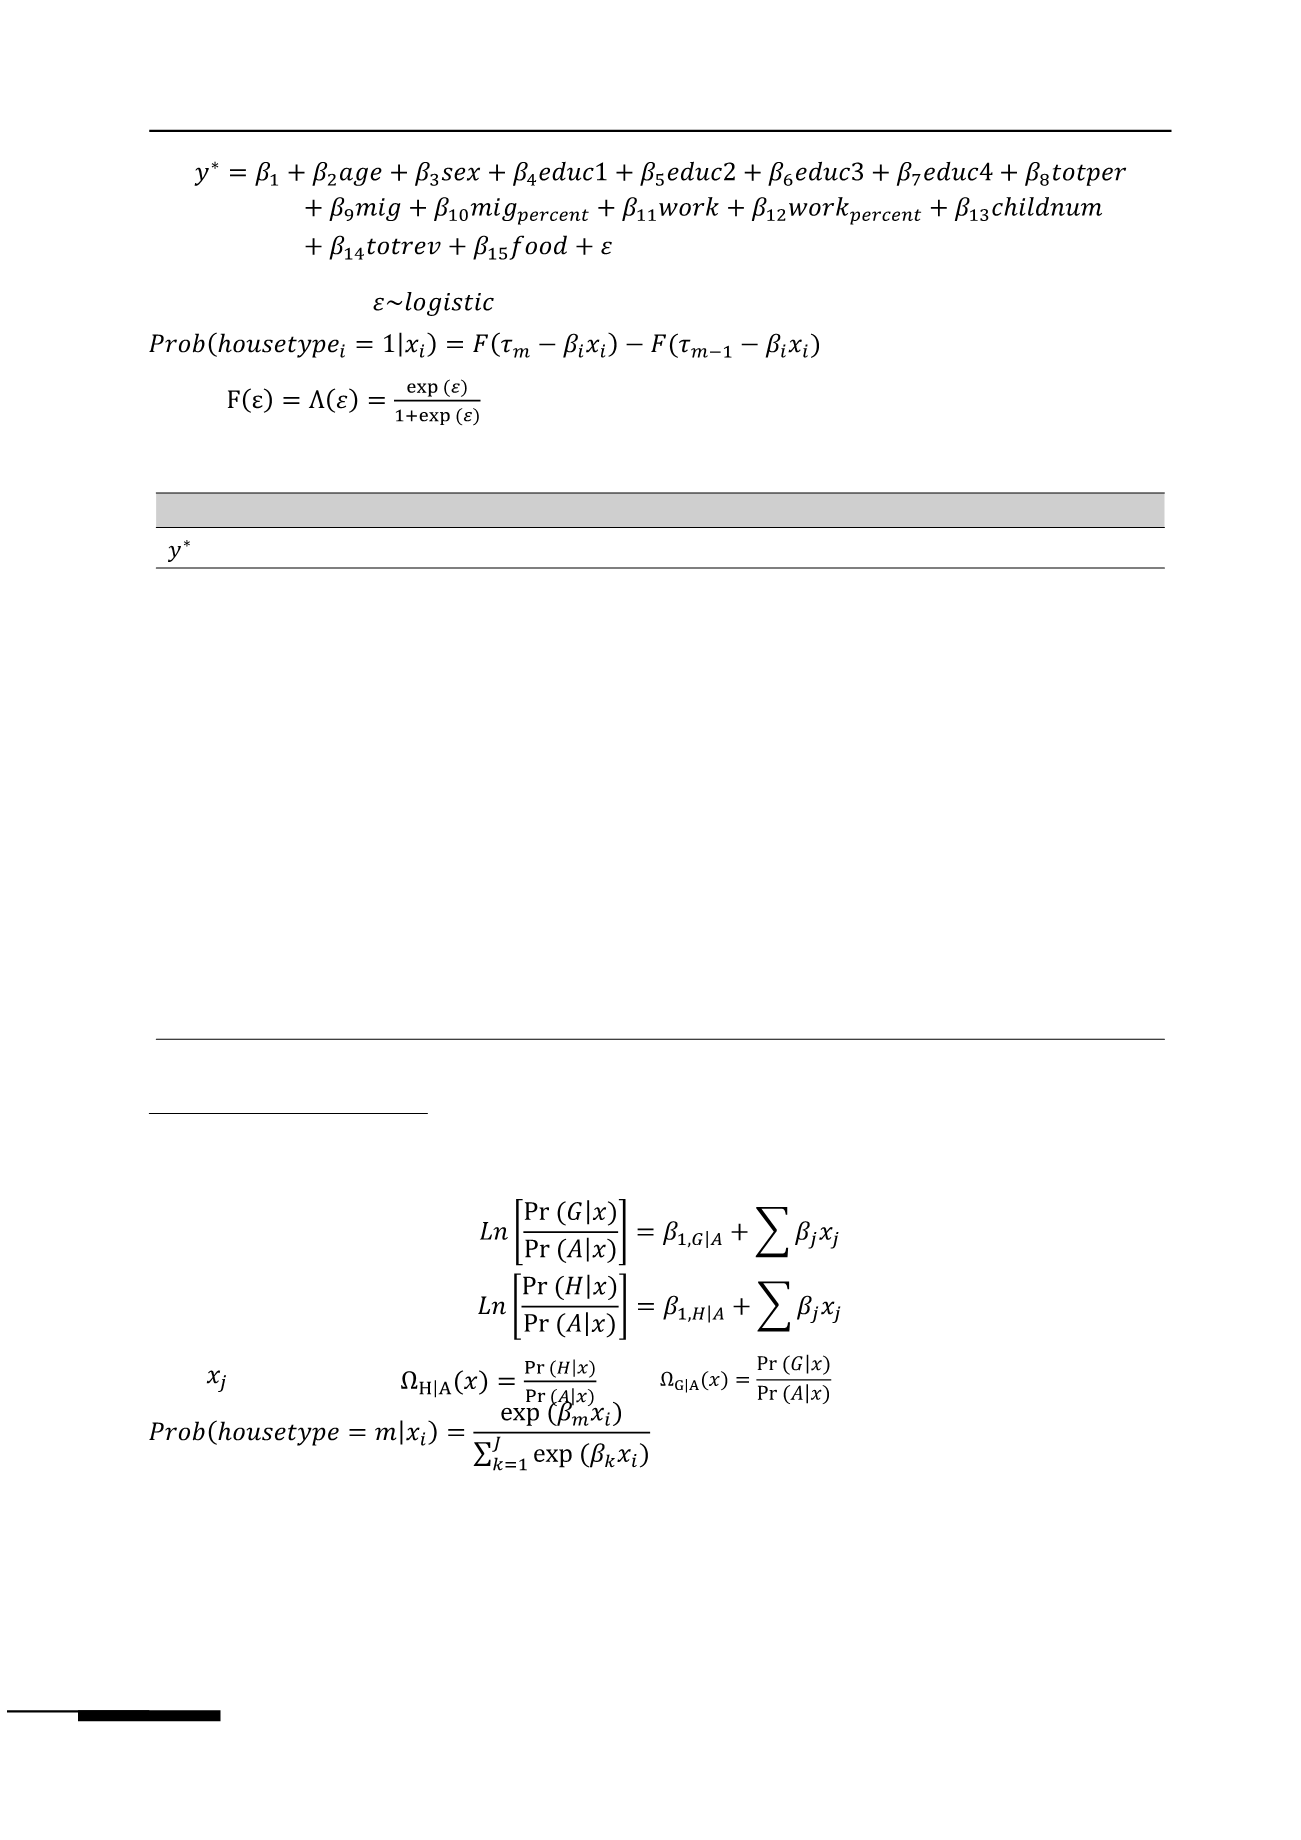
Here we assume that
then the model becomes Ordered Logit Model.
Here,
The explanations of the chosen variables are shown in Table 1.
Table 1:
Variable description
Latent variable/dependent variable
Independent variables
age
age of the head of family, in years
sex
sex of the head of family, 0 if female, 1 if male
educ1
= 1 if education level is secondary, 0 otherwise
educ2
= 1 if education level is primary, 0 otherwise
educ3
= 1 if education level is college/graduated, 0 otherwise
educ4
= 1 if education level is vocational, 0 otherwise
totper
number of person in household
mig_percent
percentage of migrants in household, %
work
=1 if he/she works, 0 otherwise
work_percent
percentage of working persons in household, %
childnum
number of children in household
totrev
total revenue of household per year, thousand tugrugs
food
percentage of food expenses in total expenditure per year, %
Multinominal Logit Model
We can capture the effects of the chosen explanatory variables by estimating two binary logit
models,
were,
-chosen factors,
and
are the odds ratio,
The models were estimated by STATA package.
Data source of the study
The data source is from the “Urban Poverty and in-Migration” survey (2004), which cover
6847 residents in 1500 households in Ulaanbaatar, capital city of Mongolia. This Survey was