


 97 / 100

The Economist
May 5th 2018
Economic and financial indicators
85
Other markets
% change on
Dec 29th 2017
Index
one
in local in $
May 2nd
week
currency terms
United States (S&P 500)
2,635.7 -0.1 -1.4 -1.4
United States (NAScomp)
7,100.9 +1.4 +2.9 +2.9
China (SSEB, $ terms)
316.0 -1.3 -7.5 -7.5
Japan (Topix)
1,771.5 +0.2 -2.5 -0.2
Europe (FTSEurofirst 300)
1,519.4 +1.9 -0.7 -1.1
World, dev'd (MSCI)
2,076.7 nil
-1.3 -1.3
Emerging markets (MSCI)
1,151.4 +1.0 -0.6 -0.6
World, all (MSCI)
506.9 +0.1 -1.2 -1.2
World bonds (Citigroup)
949.0 -0.6 -0.1 -0.1
EMBI+ (JPMorgan)
799.1 -1.0 -4.4 -4.4
Hedge funds (HFRX)
1,263.5
§
-0.2 -1.0 -1.0
Volatility, US (VIX)
16.0 +17.8 +11.0 (levels)
CDSs, Eur (iTRAXX)
†
54.9 -2.6 +21.7 +21.2
CDSs, N Am (CDX)
†
61.3 -1.0 +24.9 +24.9
Carbon trading (EU ETS) €
13.1 -3.2 +60.6 +60.0
Sources: IHS Markit; Thomson Reuters. *Total return index.
†
Credit-default-swap spreads, basis points.
§
May 1st.
The Economist
commodity-price index
2005=100
% change on
one
one
Apr 24th May 1st*
month year
Dollar Index
All Items
154.9
157.1
+3.2 +10.1
Food
157.4
163.3
+3.2 +7.3
Industrials
All
152.2
150.8
+3.1 +13.5
Nfa
†
142.7
143.1
+3.1 +3.5
Metals
156.3
154.1
+3.2 +18.0
Sterling Index
All items
201.7
210.2
+6.6 +4.7
Euro Index
All items
157.7
163.0
+5.6 +0.1
Gold
$ per oz
1,328.4 1,304.5
-1.9 +4.0
West Texas Intermediate
$ per barrel
67.7
67.3
+5.9 +41.1
Sources: Bloomberg; CME Group; Cotlook; Darmenn & Curl; FT; ICCO;
ICO; ISO; Live Rice Index; LME; NZ Wool Services; Thompson Lloyd &
Ewart; Thomson Reuters; Urner Barry; WSJ. *Provisional
†
Non-food agriculturals.
Markets
% change on
Dec 29th 2017
Index
one
in local in $
May 2nd
week
currency terms
United States (DJIA)
23,925.0
-0.7
-3.2
-3.2
China (SSEA)
3,226.9
-1.2
-6.8
-4.6
Japan (Nikkei 225)
22,472.8
+1.2
-1.3
+1.1
Britain (FTSE 100)
7,543.2
+2.2
-1.9
-1.4
Canada (S&P TSX)
15,627.9
+0.8
-3.6
-6.0
Euro area (FTSE Euro 100)
1,236.1
+2.0
+2.2
+1.7
Euro area (EURO STOXX 50)
3,553.8
+1.9
+1.4
+1.0
Austria (ATX)
3,475.8
+0.9
+1.6
+1.2
Belgium (Bel 20)
3,920.9
+0.7
-1.4
-1.9
France (CAC 40)
5,529.2
+2.1
+4.1
+3.6
Germany (DAX)*
12,802.3
+3.1
-0.9
-1.3
Greece (Athex Comp)
858.1
+3.9
+6.9
+6.5
Italy (FTSE/MIB)
24,265.6
+2.0
+11.0 +10.6
Netherlands (AEX)
555.9
+0.7
+2.1
+1.6
Spain (IBEX 35)
10,088.9
+2.3
+0.4
nil
Czech Republic (PX)
1,116.9
-0.4
+3.6
+3.0
Denmark (OMXCB)
909.9
+4.0
-1.9
-2.3
Hungary (BUX)
37,969.8
-0.2
-3.6
-5.2
Norway (OSEAX)
985.1
+3.5
+8.6
+9.5
Poland (WIG)
60,066.5
+1.4
-5.8
-8.5
Russia (RTS, $ terms)
1,136.6
-0.1
-1.5
-1.5
Sweden (OMXS30)
1,591.0 +2.2 +0.9 -7.5
Switzerland (SMI)
8,896.3 +1.8 -5.2 -7.5
Turkey (BIST)
104,725.7
-2.5
-9.2
-17.6
Australia (All Ord.)
6,136.7
+2.1
-0.5
-4.4
Hong Kong (Hang Seng)
30,723.9
+1.3
+2.7
+2.3
India (BSE)
35,176.4
+2.0
+3.3
-1.1
Indonesia (JSX)
6,012.2
-1.1
-5.4
-8.0
Malaysia (KLSE)
1,852.0
nil
+3.1
+6.0
Pakistan (KSE)
45,196.4
-1.1
+11.7
+6.6
Singapore (STI)
3,615.3 +1.3 +6.2 +6.2
South Korea (KOSPI)
2,505.6 +2.3 +1.5 +1.0
Taiwan (TWI)
10,618.8 +0.6 -0.2 -0.2
Thailand (SET)
1,791.1
+0.7
+2.1
+4.9
Argentina (MERV)
29,614.0
-1.1
-1.5
-11.3
Brazil (BVSP)
84,547.1
-0.6
+10.7
+3.4
Chile (IGPA)
28,648.7
+0.5
+2.4
+1.8
Colombia (IGBC)
12,427.2
+0.9
+8.3 +14.1
Mexico (IPC)
47,810.0
-0.5
-3.1
-0.9
Peru (S&P/BVL)*
21,328.9
-0.1
+6.8
+6.0
Egypt (EGX 30)
18,173.2
+0.3
+21.0 +21.6
Israel (TA-125)
1,333.7
+0.6
-2.2
-6.4
Saudi Arabia (Tadawul)
8,158.1
-0.9
+12.9 +12.9
South Africa (JSE AS)
58,450.4
+2.6
-1.8
-4.3
Ind
i
cato
r
s
for more countries and additional
series, go to:
Economist.com/indicators*Real GDP per hour worked
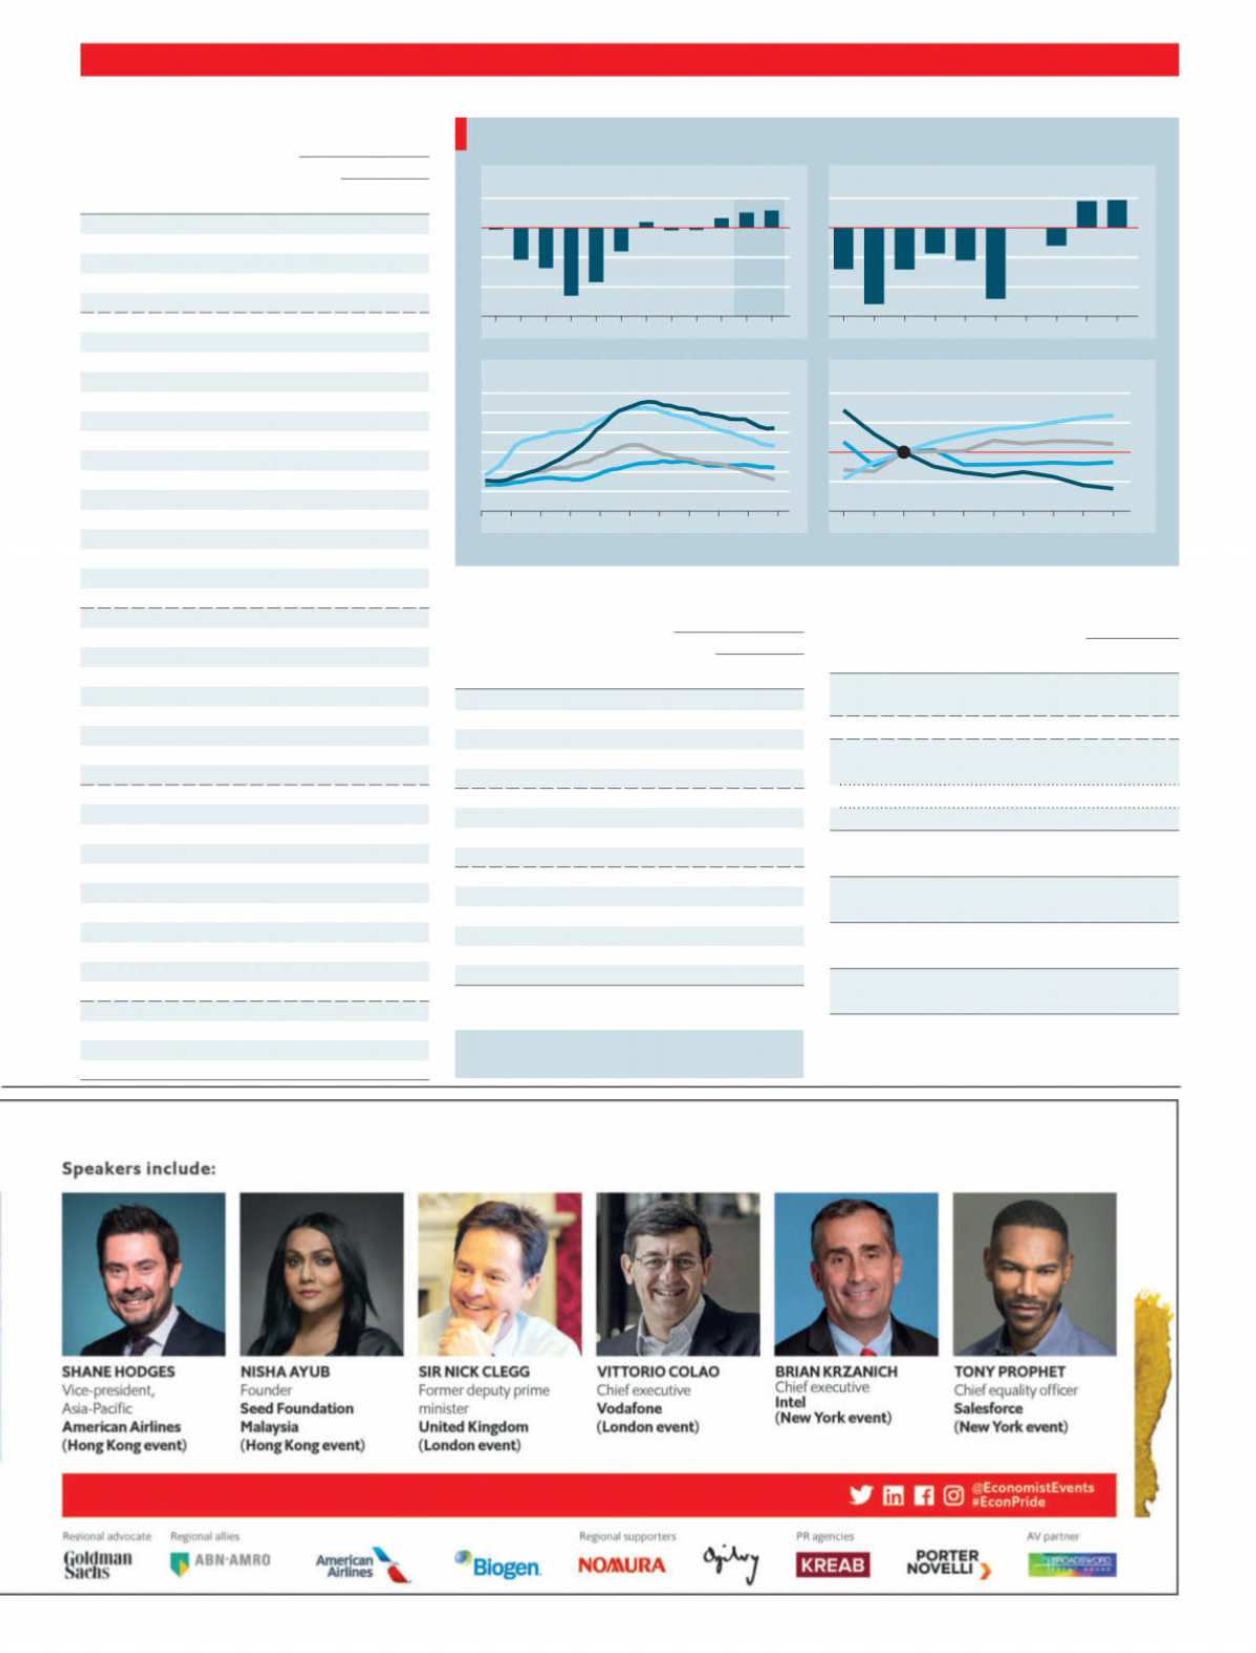
Greece
Source: OECD
GDP, % change on a year earlier
Primary budget balance, % of GDP
Unemployment rate, %
Productivity*, 2010=100
FORECAST
12
8
4
0
4
+
–
200809 10 11 12 13 14
15 16 17 18 19
12
8
4
0
4
+
–
2008 09 10 11 12 13 14 15 16 17
2008 09 10 11 12 13 14 15 16 17
0
5
10
15
20
25
30
Greece
Italy
Spain
Portugal
90
95
100
105
110
2008 09 10 11 12 13 14 15 16 17
Greece
Italy
Portugal
Spain
РЕЛИЗ ПОДГОТОВИЛА ГРУППА "What's News"
VK.COM/WSNWS